In this story
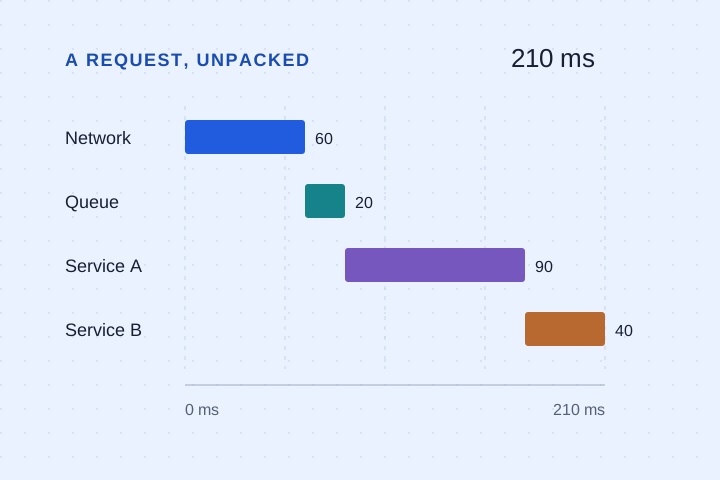
A request takes 210 milliseconds. That number tells you what the caller waited. It doesn’t tell you where the time went, or which part you can change.
Start by drawing the path. In the simple model below, a request spends 60 ms on the network, 20 ms waiting in a queue, 90 ms in one service, and 40 ms in another. When everything happens sequentially, those durations add up.
Follow the critical path
The critical path is the chain of work that determines when the result can be ready. If service B needs service A’s output, both durations belong on that chain. Starting B earlier isn’t a valid optimization because its input doesn’t exist yet.
If the two services are independent, they can overlap. Under the assumptions of this model, their contribution becomes the longer duration: 90 ms. Network and queue time still remain. The new total is 60 + 20 + 90 = 170 ms.
Change the conditions
Move the sliders. Try making the network slower, then switch between sequential and parallel work. We kept the experiment small so the relationship is easy to see.
Each stage waits for the previous one. The durations add up.
An illustrative model, not a benchmark. Assumes fixed durations, a single queue, and no concurrency overhead. Network time is the total round trip.
Notice what happens when one service takes no time. Running it in parallel saves nothing. Notice what happens when both take the same time. Overlapping them removes one full service duration from the path.
Measure the system you actually have
Real requests don’t arrive at neat intervals. Queue time changes with load. A service may wait on another service, contend for a connection pool, or perform several internal operations. Running independent calls together can increase contention if they share a scarce resource.
Measure durations at boundaries you control and keep them attached to a request or trace. In a browser, Server-Timing (opens in a new tab) lets a server expose named timing measurements to developer tools. Choose meaningful labels and avoid exposing sensitive infrastructure details.
An average hides the slow requests
A single total also hides variation. Look at a distribution of measurements, including the slower requests your users encounter. A fast median alongside a slow tail points you toward a different investigation than a uniformly slow path.
Speeding up the shortest stage may be easy, but it can never save more time than that stage takes. Draw the path first, then decide where to spend the effort.